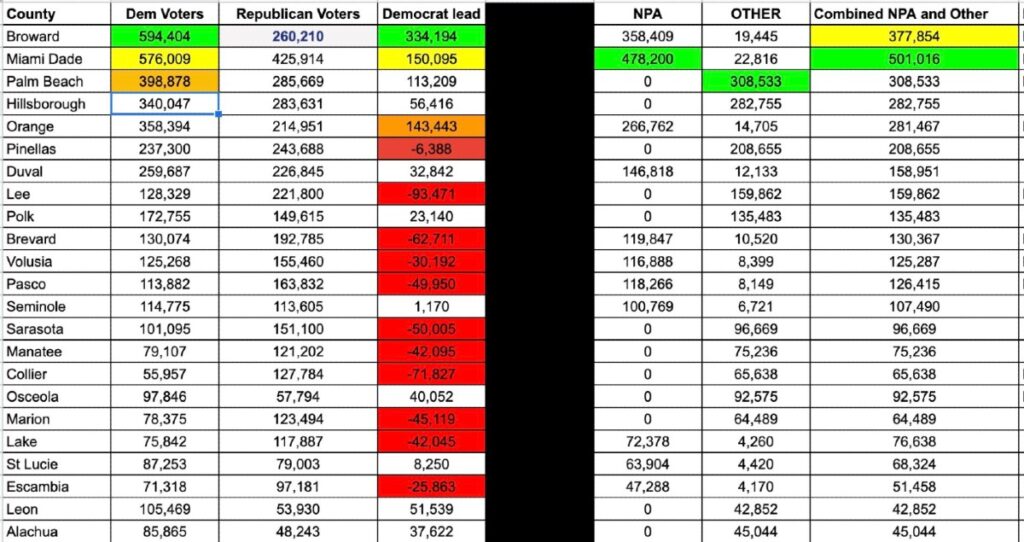
| County | Democrat | Republican | Dem Lead | No Party | Categorized “Other” | Combined NPA and “Other” |
| Broward | 594,404 | 260,210 | 334,194 | 358,409 | 19,445 | 377,854 |
| Miami Dade | 576,009 | 425,914 | 150,095 | 478,200 | 22,816 | 501,016 |
| Palm Beach | 398,878 | 285,669 | 113,209 | N/A | 308,533 | 308,533 |
| Hillsborough | 340,047 | 283,631 | 56,416 | N/A | 282,755 | 282,755 |
| Orange | 358,394 | 214,951 | 143,443 | 266,762 | 14,705 | 281,467 |
COUNTIES HOME TO COLLEGE TOWNS
| County | Democratic Voters | Republican Voters | Democrat Lead | NPA | OTHER | Combined NPA and Other |
| Leon | 105,469 | 53,930 | 51,539 | 0 | 42,852 | 42,852 |
| Alachua | 85,865 | 48,243 | 37,622 | 0 | 45,044 | 45,044 |
For more stories on Florida politics, visit our Florida political news section.